There are several ways to extract the logs from a Kubernetes Nginx Ingress deployment into an ElasticSearch instance. One way I found was to use Elastic Filebeats, but I couldn’t find any really good examples of how to apply that to our cluster, and I felt it would clutter up the proxy servers with more containers they may not necessarily need.
Instead, I chose to use nginx’s syslog facility, which is a little more lightweight, and serves our purposes for now.
Essentially, in this post I will configure syslog access and error logging on the K8S nginx ingress deployment, and have that send access logs via syslog UDP packets to a NodeRED flow which passes them through to ElasticSearch.
I’ve chosen to use a NodeRED to translate the syslog packets for consumption by ElasticSearch as it allows me a lot more flexibility, but you could probably also use the syslog input plugin for Logstash if it’s more suitable for you.
This is just a high-level overview to keep it brief. I do not try to cover the setup or configuration of the components used (i.e. the K8S manifests etc.)
Pre-requisites
We’ll assume that you have ElasticSearch running somewhere, and that it is accessible via the hostname ’elasticsearch’, and we can post entries to it via HTTP port 9200. We’ll also assume you have configured Kibana, for querying the ElasticSearch indexes.
We’ll assume that you have a NodeRED instance or container running in close proximity to the ElasticSearch instance or container, and that it is configured to listen to UDP port 1514, using the hostname ’nodered’. In my scenario, it’s another deployment in the same K8S namespace, on the same host node. For the real setup I prefer to use internal IP addresses rather than a hostname, as if the hostname lookup fails nginx ingress can fail to start up, which is not a good thing to happen to production clusters when you least expect it.
We’ll assume you have a Kubernetes cluster running Nginx Ingress, and that it refers to a ConfigMap called ’nginx-configuration'.
Nginx to NodeRED
First, update the ConfigMap to direct the access logs via syslog…
apiVersion: v1
kind: ConfigMap
metadata:
  name: nginx-configuration
  namespace: ingress-nginx
data:
  enable-syslog: "true"
  log-format-escape-json: "true"
  log-format-upstream: '{ "time": "$time_iso8601", "remote_addr": "$proxy_protocol_addr","x-forward-for":
    "$proxy_add_x_forwarded_for", "request_id": "$req_id", "remote_user":"$remote_user",
    "bytes_sent": $bytes_sent, "request_time": $request_time, "status":$status, "vhost":
    "$host", "request_proto": "$server_protocol", "path": "$uri","request_query":
    "$args", "request_length": $request_length, "duration": $request_time,"method":
    "$request_method", "http_referrer": "$http_referer", "http_user_agent":"$http_user_agent"
    }'
  syslog-host: nodered
  syslog-port: "1514"
To check that changes have been applied, I tend to get a shell on one containers and grep log_format /etc/nginx/nginx.conf.
If that shows the JSON log format, the sites are still working, and there are no significant errors/warnings in the container logs for the nginx containers, then we can move on.
NodeRED to ElasticSearch
Now, on the NodeRED instance, you need to import a new flow…
https://gist.github.com/rossigee/6510ca9226c31bb021d40dcf72855101
This will look a bit like this…
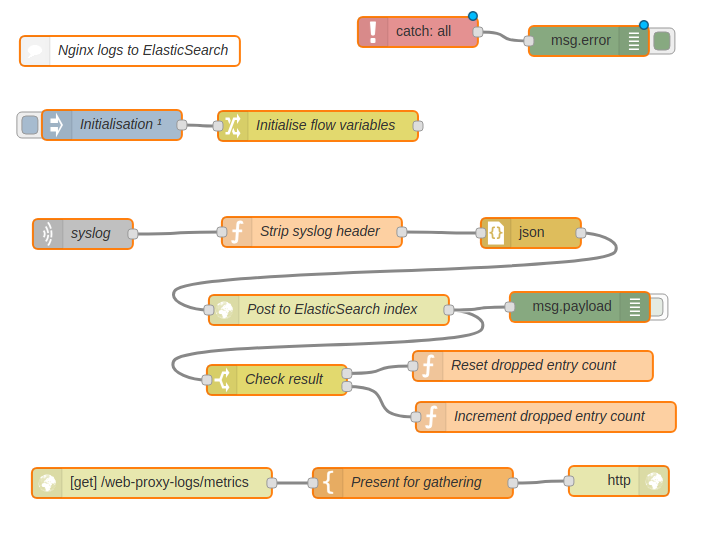
If you enable the toggle on the poorly-named ‘msg.payload’ node, you should start to see the flow of entries in the debug panel on the right.
If you do not see any activity in the debug logs, and you are sure your proxies are receiving hits, you should check that the syslog packets are being transmit correctly between the nginx proxy hosts and transported correctly to the NodeRED flow correctly. You can check for transmission errors in the nginx proxy logs and you can use tcpdump/wireshark to confirm/deny the presence of UDP port 1514 traffic between the two.
Elasticsearch and Kibana
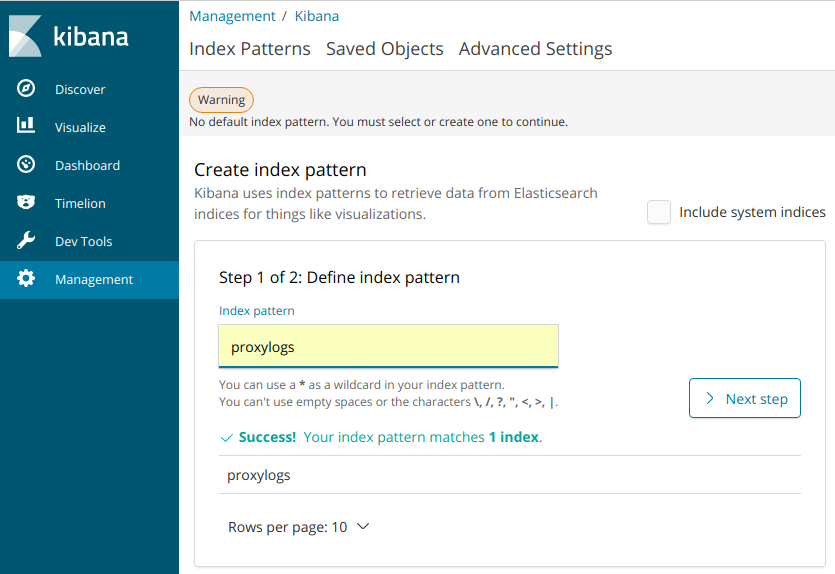
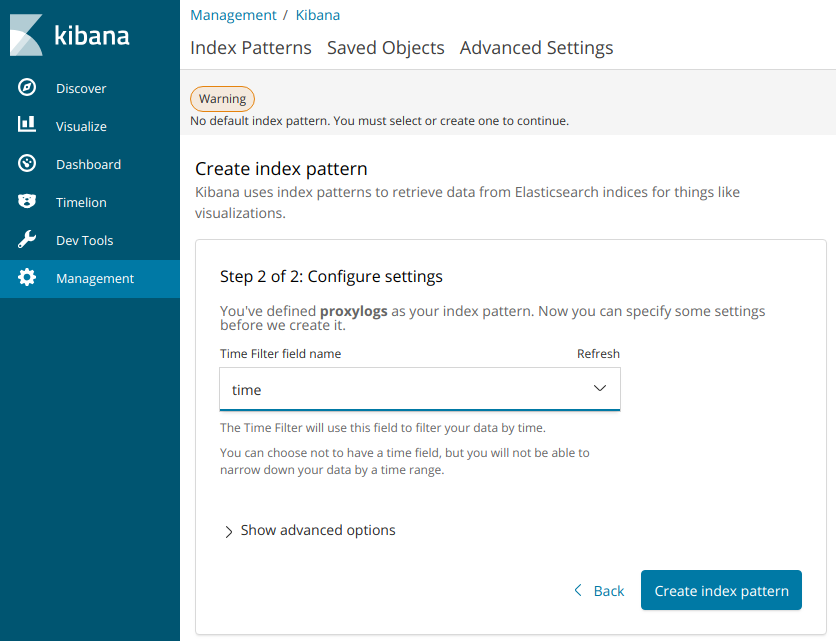
So, if all is going well, ElasticSearch is now gathering a proxylogs index containing all the latest nginx ingress access logs. You just need to tell Kibana about that index. Go to ‘Management > Index Patterns’ in the Kibana UI, then select the proxylogsindex.
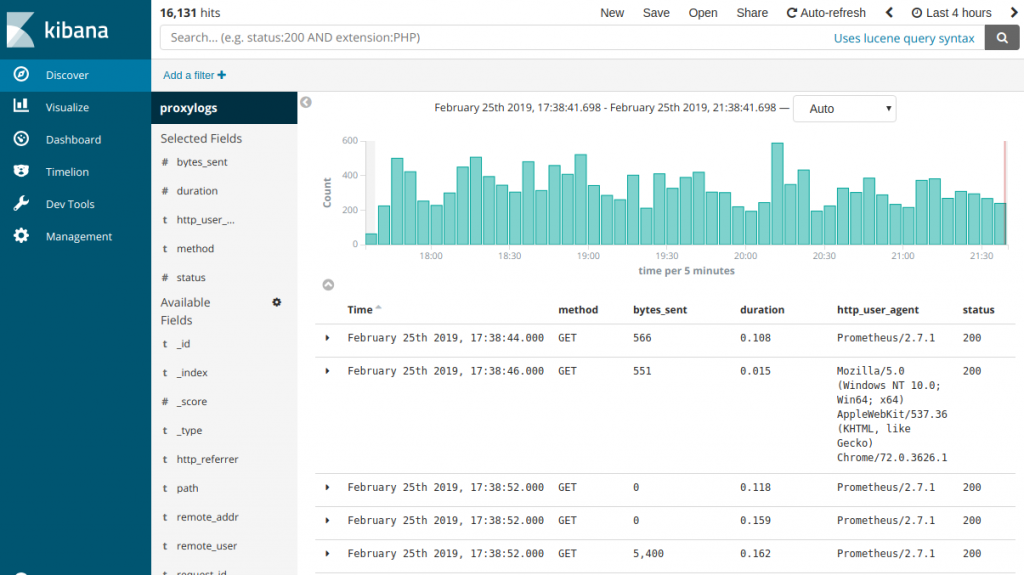
Then, in the ‘Dashboard’, you should be able to start drilling down into the logs gathered so far.
Monitoring
Additionally, the NodeRED flow above incorporates a simple health check designed to be monitored by our Prometheus servers. If the ElasticSearch doesn’t return a success response, it increments a ‘dropped entry’ counter, which it presents in Prometheus scrape format at the /web-proxy-logs/metrics endpoint. Prometheus can then raise an alert if that goes above zero for any significant amount of time. You may not need this and can remove that functionality from the flow if it’s not of use to you.
Alerting
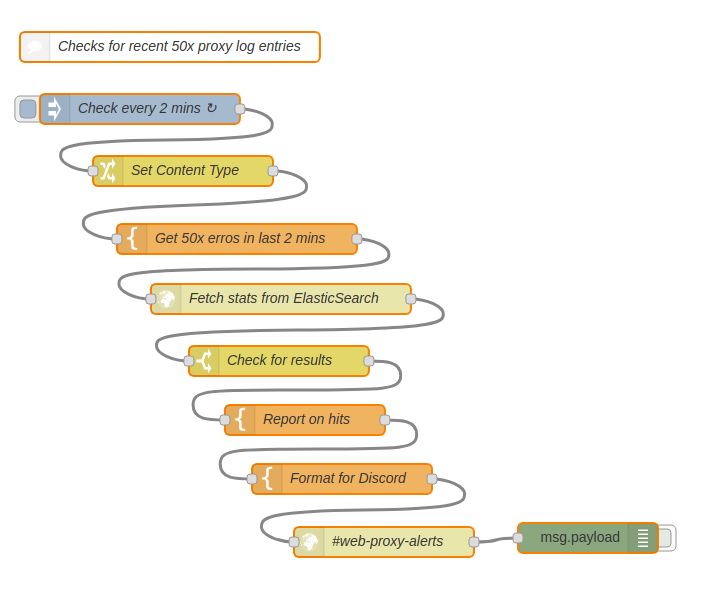
Of course, once your live access logs are being fed into ES you can start to consider setting up alerts to notify you of undesirable conditions, such as excessive 50x status codes, excessive login attempts, page load times etc. There are lots of things you might like to be alerted about and several mechanisms for doing this. Hopefully I will have more time to look into ElasticSearch’s own Alerting solution and maybe write a future blog post about that.
However, for the purposes of this post I’ll demonstrate yet another use case for NodeRED. It really is an incredibly flexible tool, and worthy of a place in any sysadmin’s toolkit. In this case, I added a simple flow to check the ES logs every two minutes and let me know via Discord whether there were any 50x status codes since the last run.
https://gist.github.com/rossigee/3ec5db7a68660474dfa96c5e04bb3696
Security
It is worth protecting the UDP port from public access. You should create a firewall rule or NetworkPolicy to ensure UDP packets from the proxy host IPs to port 1514 are accepted, and others rejected.